My thesis project, FitHub, is focused in personal data and what information and experiences can be obtained when combining a multitude of different data sets from fitness tracking devices and applications. In order to get data from these devices (e.g. Fitbit, Withings Scale, Body Media), a web-based platform will parse data from the applications and provide a foundation of personal metrics.
Once obtained, the data will be presented as a visualization both on a web platform and in real-life with the purpose of showing how one piece of information relates to another as well prompting a call to action. The real world visualization will manifest as an ambient object reflecting one’s physical state on the basis of their data streams. Objects will be placed around the house as a reminder to get more sleep, get some exercise or stay hydrated.
I was able to find 5 projects from the past few years of DT that more or less relate to my project:
- Databoard.me Evan You, 2012
- Don’t Flush Me Leif Percifield, 2012
- <120 over 80 Karen Everett, 2011
-
Makin’ Moves Makenzie Rasmussen, 2011
- Intangible Denise Flasz, 2010
I felt Leif’s project has the most relevance because this system was visually relaying data, the current condition of the New York sewer system, to a user by changing the state of an ambient object signifying whether or not one should conserve water, or freely flush. Interestingly, in 2010 a group called Teague Labs created a water meter project, where they could measure the flow of water from a faucet and graph the usage back to the user, signifying whether or not they are doing a good job at conserving water.
Both these projects demonstrate how different sensors can provide a multitude of data, the question is, how can you effectively relay data back to someone while provoking an action?
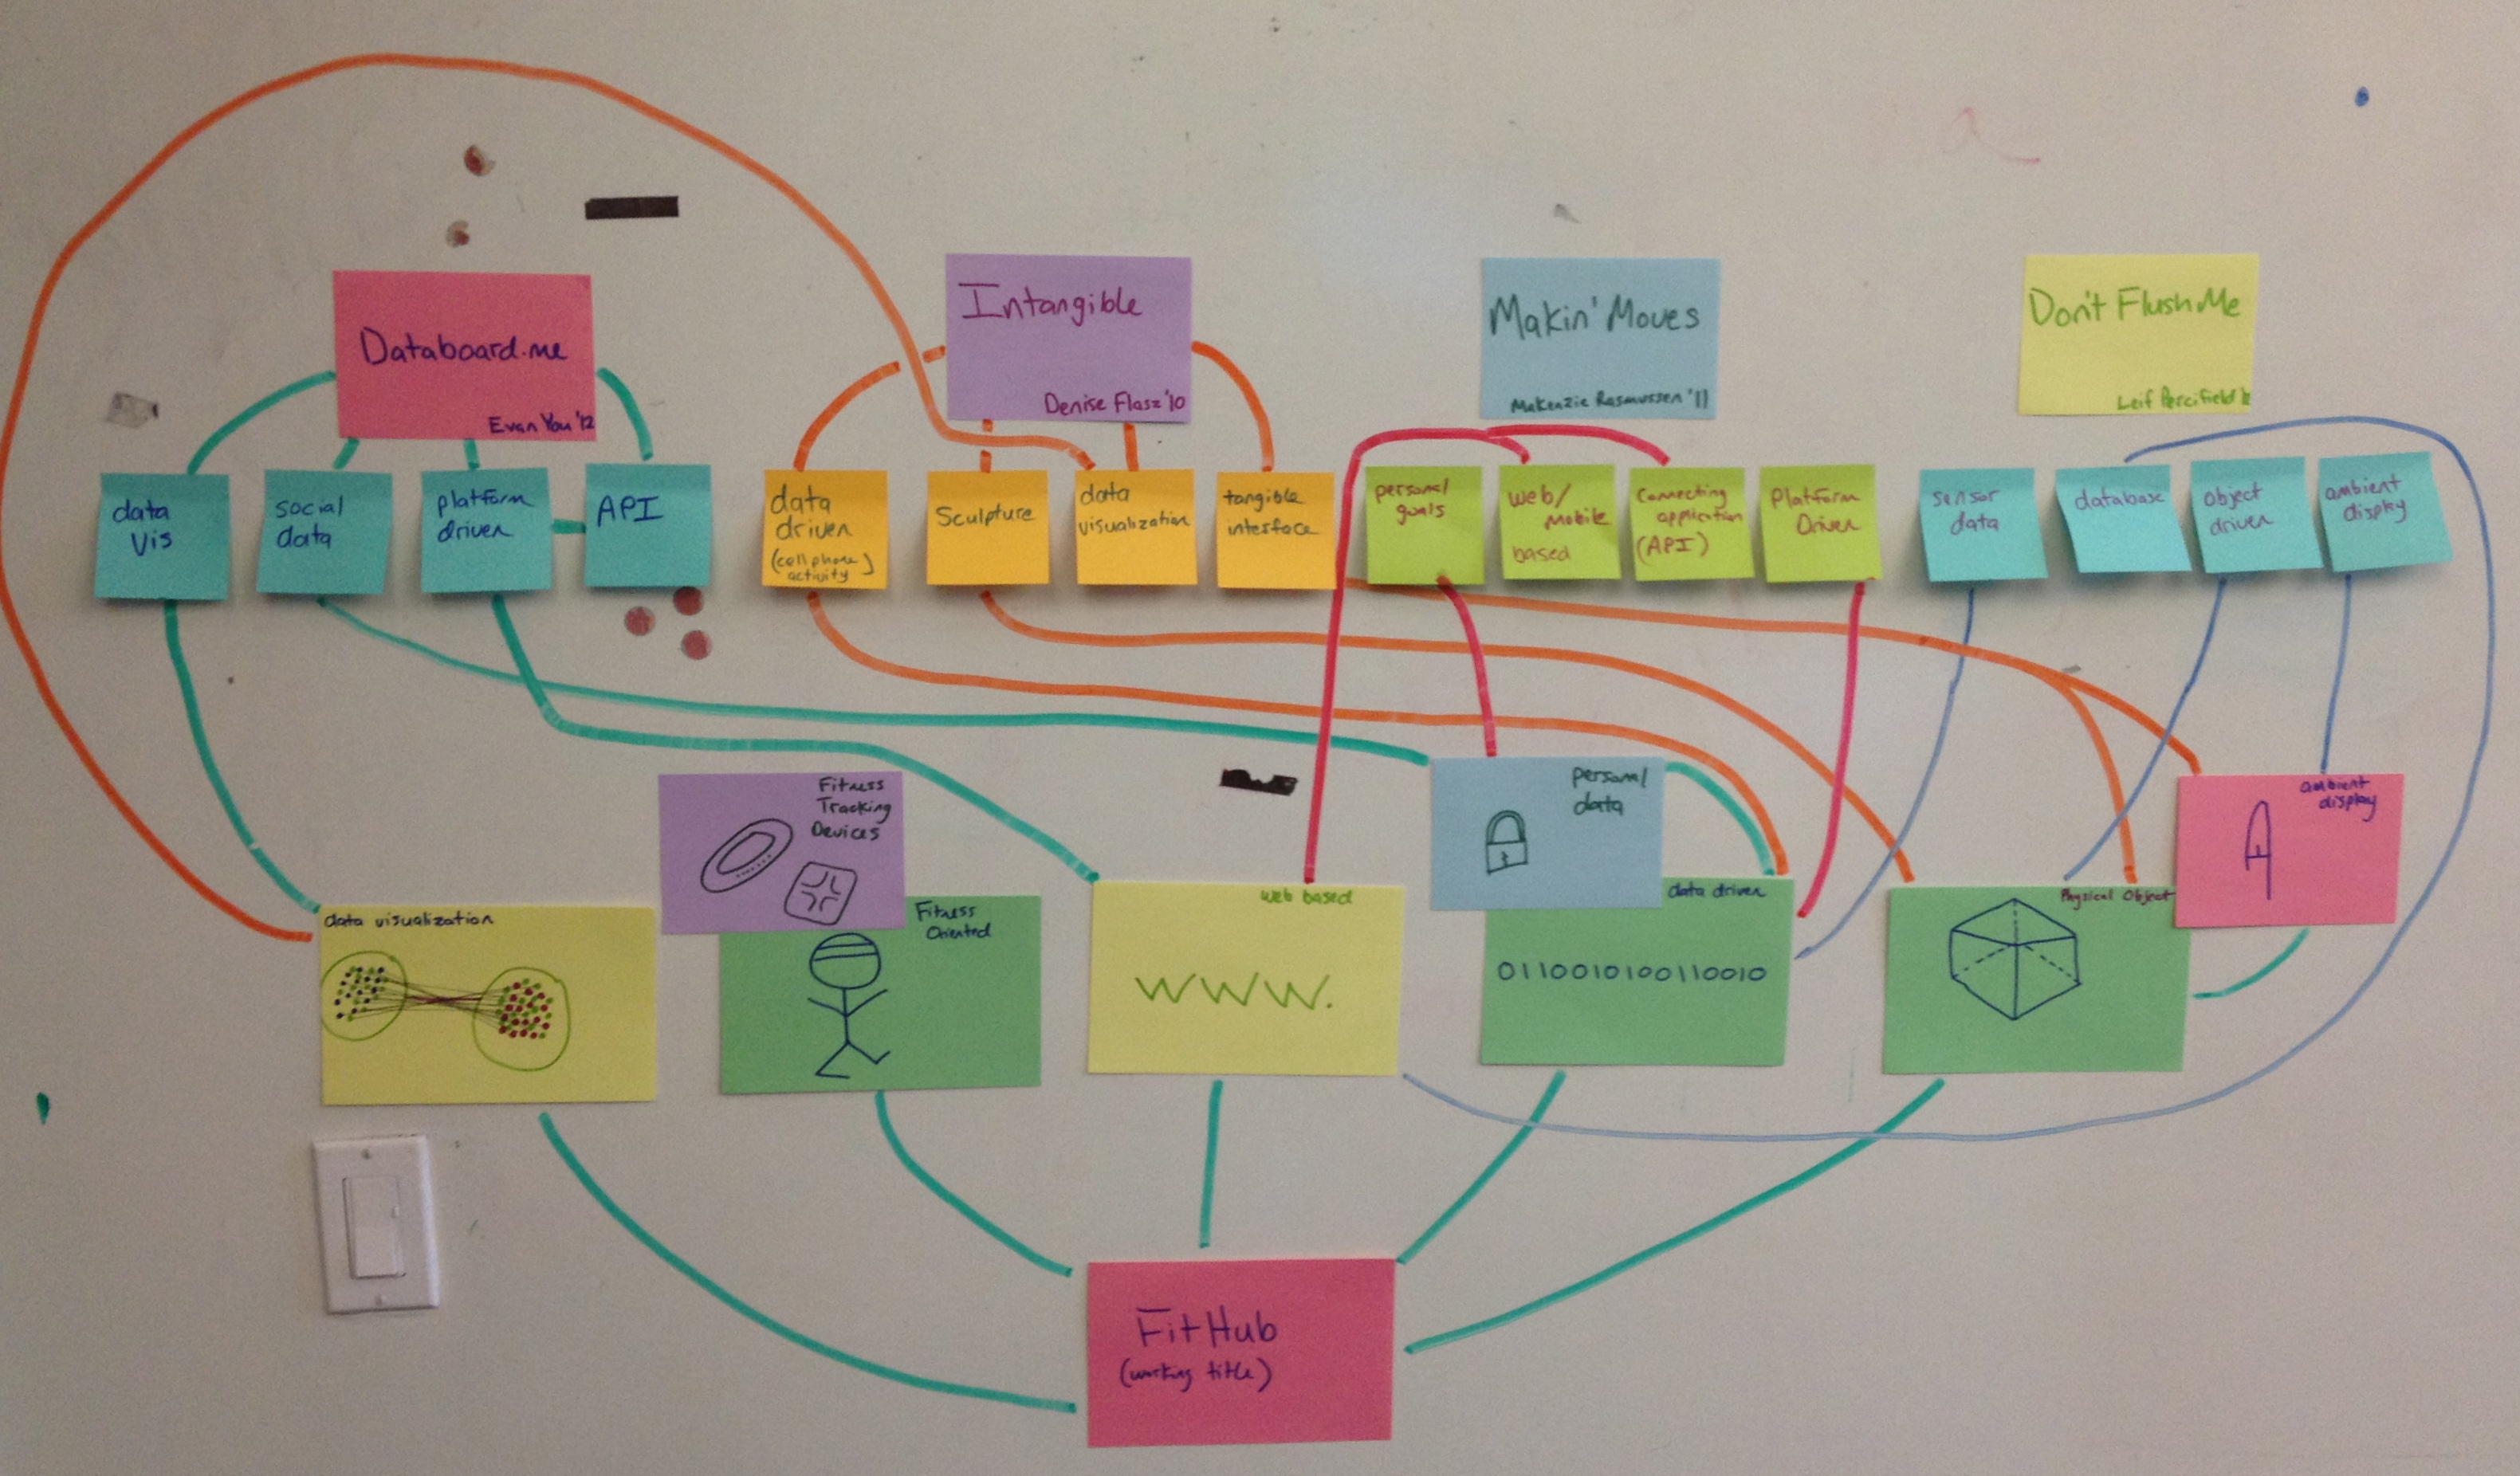
Below are images from the mapping activity which graphically draw domain relationships between these past thesis projects (except for <120 over 80, I ran out of time) and FitHub. I got a lot out of this exercise, and I think it is only helping me reinforce what my goals are for the project. I’ve discovered that prior to Leif, not many attempts have been made in DT at devising an object-based data visualization, rather, most have been software based. This has peaked my interest in bringing new information about ourselves into the real world. Link to close-up images.